Datasets:
Overview
This dataset contains the number of yearly deaths due to Unintentional Drug Overdoses in the United States at a County Level between 2003-2015. To overcome the limitation of the original dataset, it is merged with population dataset to identify missing combinations and imputation is performed on the dataset taking into account the logical rules of the source dataset. Users can decide the proportion of the imputed values in the dataset by using the provided population and flag columns. Additional fields like state codes, FIPS codes are provided for the convenience of the user so that the dataset can be merged easily with other datasets.
Data Structure
The dataset contains the following fields:
- State (string): Name of the State
- State_Code (string): 2 Character abbreviation of the state
- County (string): Name of the County
- County_Code (string): 5 Charter representation of the County’s FIPS code
- Year (integer): Year
- Population (integer): Population of the County for the given year
- Deaths (integer): number of Drug overdose deaths in the county for the given year
- Original (Boolean): To indicate if the Deaths are from original dataset or imputed
- State_Mortality_Rate (float): Mortality rate of the state for the given year
- County_Mortality_Rate (float): Mortality rate of the county for the given year
Notes:
- County FIPS has been formatted as a string so that leading zeros are not lost and it is easier for the user to read it
- The County_Mortality_Rate which is provided for convenience is calculated after the imputation of the missing values, hence it might not be accurate for all the combinations, refer the "Original" column to identify the imputed values.
Data Source
Deaths Data: The original source of the data is the US Vital Statistics Agency Link, however, for this project, it has been downloaded from a different source for convenience.
Population Data: To have consistency with the Mortality Data, the population Data has been downloaded from the CDC Wonder portal. Population data is used for 2 purposes: to calculate the mortality rate and as a master list of Counties to perform the Imputation
Other Data: To provide convenience to the users of the Dataset, additional fields such as County Fips, State Codes etc. have been added so that users can easily combine it with other datasets if required. This mapping is a standard mapping which can be found on the internet.
The raw data files are present in the .01_Data/01_Raw folder for reference.
Methodology
To study the impact of drug related deaths, one of the primary sources is the US Vital Statistics Agency. There is a limitation in the report since US Vital Statistics does not report the deaths in a county if the number of deaths in that county is less than 10 for privacy reasons. This means that the deaths available in the report are not fully representative of the deaths and hence any analysis performed on it may not be fully accurate. To overcome this, in this dataset, values are imputed for the missing counties based on State level mortality rates and population limiting factors. While this may not be 100% representative, it gives a slightly different and better approach to perform analysis on the drug related deaths.
Post the basic data cleaning and merging, the imputation is performed in the following steps:
- Mortality Rate is calculated at the State-Year level using the available data
- Master combination of State-County is obtained from Population file
- For the missing counties a reverse calculation is performed using the state level mortality rate and the population of the county. A maximum calculated limit of 9 is imposed to preserve the conditions of the original data set.
- Flag column is added to indicate if the values seen are original values or imputed ones
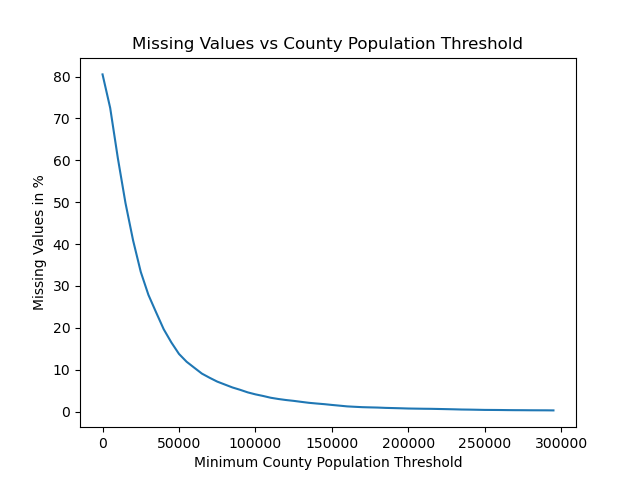
Since the original trend of the dataset may distort due to the imputations, the population data is left in the dataset and an additional column is added to the dataset to indicate if the values seen are from the original dataset or if they were imputed. Using the population and the flag column, the users of the dataset can decide the proportion of the imputed data in the analysis (This is the population limit factor).
The below graph shows the relation between the population limit factor and the % of imputed values in the dataset:

Files and Folder Structure
- Data Files: The raw data files are present in the .01_Data/01_Raw folder for reference. The intermediate Population and Mortality files are present in the .01_Data/02_Processed folder. The final dataset is present in the root folder.
The Data folder is hidden so that the raw and itermediate files are not loaded by the library.
- Code Files: The code files are present in the 02_Code folder.
- The "*_eda.ipynb" files are the exploratory files which the user can refer to understand the processing of the data in a step by step manner.
- The "*_script.py" files are the optimized scripts which contain only the required steps from the eda files to process the data.
provided the raw data files are present in the .01_Data/01_Raw folder, all the other intermediate and final data files can be generated using the script files provided in the 02_Code folder.
Disclaimers
- This dataset has been created purely for educational purposes. The imputations performed is one of the many ways to handle the missing data, please consider the % of imputed data in the dataset before performing any analysis.
- The Dataset does NOT contain data for Alaska since the original data for it is messsy, users can however make use of the raw files and modify the scripts if required to include Alaska
- Please refer to the original source of the data (links provided in the data source section) for any legal or privacy concerns.