Dataset Viewer
Full Screen Viewer
Full Screen
The viewer is disabled because this dataset repo requires arbitrary Python code execution. Please consider
removing the
loading script
and relying on
automated data support
(you can use
convert_to_parquet
from the datasets library). If this is not possible, please
open a discussion
for direct help.
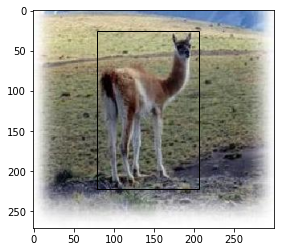
Code snippet to visualise the position of the box
import matplotlib.image as img
import matplotlib.pyplot as plt
from datasets import load_dataset
from matplotlib.patches import Rectangle

# Load dataset
ds_name = "SaulLu/Caltech-101"
ds_config = "without_background_category"

ds_without = load_dataset(ds_name, ds_config, use_auth_token=True)

# Extract information for the sample we want to show
index = 100
sample = ds_without["train"][index]
box_coord = sample["annotation"]["box_coord"][0]
img_path = sample["image"].filename

# Create plot
# define Matplotlib figure and axis
fig, ax = plt.subplots()

# plot figure
image = img.imread(img_path)
ax.imshow(image)

# add rectangle to plot
ax.add_patch(
    Rectangle((box_coord[2], box_coord[0]), box_coord[3] - box_coord[2], box_coord[1] - box_coord[0], fill=None)
)

# display plot
plt.show()
- Downloads last month
- 263
